For investors and traders in India, success in the capital markets demands a strategy that looks deeper than the headline movements of the Nifty 50 index. To truly understand market sentiment and make informed decisions, a holistic approach is essential. This involves integrating visual analytical tools with hard institutional data before deploying your capital.
Step 1: Decipher Market Health with the Nifty 50 Heatmap
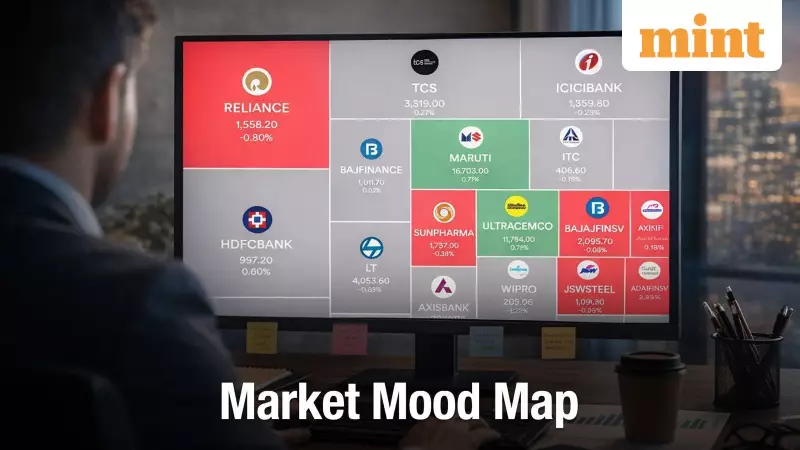
Your first analytical stop should be the Nifty 50 Heatmap. This powerful visual tool offers an instant, colour-coded snapshot of the market's dominant trend. Each of the 50 index constituents is represented as a tile, with its size proportional to the stock's weight in the index. Green tiles indicate rising stocks, while red tiles show decliners, with colour intensity reflecting the magnitude of the price change.
This visualisation helps you instantly discern whether an index move is broad-based or driven by a handful of stocks. For example, a rally concentrated in a few large green tiles in the banking or IT sector suggests a narrow advance, which could be a warning sign. Conversely, if the Nifty is only slightly up but the heatmap displays a scattered mix of light colours, the underlying momentum may be weak. Crucially, a large red tile from a heavyweight like Reliance Industries or HDFC Bank can drag the entire index down, masking strength elsewhere. The heatmap thus shifts your focus from a single index number to the vital sectoral trends and risk concentrations beneath the surface.

Step 2: Follow the Smart Money with FII and DII Data
After assessing market structure, the next step is to track capital flows from institutional investors, often called 'smart money'. The daily net activity of Foreign Institutional Investors (FII) and Domestic Institutional Investors (DII) is a critical gauge of market direction.
FIIs, which include global hedge funds and pension funds, are influenced by factors like US Federal Reserve policies and global commodity prices. Their sustained net buying often signals international confidence and can fuel rallies, especially in sectors like IT and pharmaceuticals. On the other hand, DIIs, such as Indian mutual funds and insurance companies, are powered by domestic savings and SIP inflows. They frequently provide market stability by becoming net buyers when FIIs sell, cushioning downturns and reflecting domestic faith in the economy's long-term story.
Monitoring these flows together offers profound insight. When both FIIs and DIIs are net buyers, it indicates strong, consensus-driven bullish sentiment. Persistent selling by both groups, however, signals widespread caution. This data acts as a reality check against daily volatility, revealing the sustained capital movements that shape longer-term trends.
Step 3: Apply Findings with a Stock Screener for Precision
The final step is to translate broad market analysis into actionable stock picks. Here, a stock screener becomes your tool for precision. Use the insights from the heatmap and institutional flows to define your screening universe.
Start with a Macro Filter based on sentiment: check if FII/DII flows are consistently positive, confirming a supportive bullish environment. Next, apply a Sector Filter: use the heatmap to identify outperforming sectors, like automobiles showing deep green momentum. Finally, use the Stock Filter function of the screener to pinpoint specific companies within that sector that meet your technical and fundamental criteria, such as strong volume, favourable moving averages, and sound valuation.
Relying on a single metric is a risky strategy in a complex market. This three-pillar approach—combining the visual efficiency of the heatmap, the capital flow intelligence of FII/DII data, and the precision of a stock screener—empowers you to make more informed, risk-aware decisions. By integrating these analytical layers, you move beyond surface-level noise to gain a validated understanding of market trajectory and identify the stocks best positioned to perform.