Punjab's Economic Growth Moderates to 6.1% in 2025-26, Lags Behind National Average
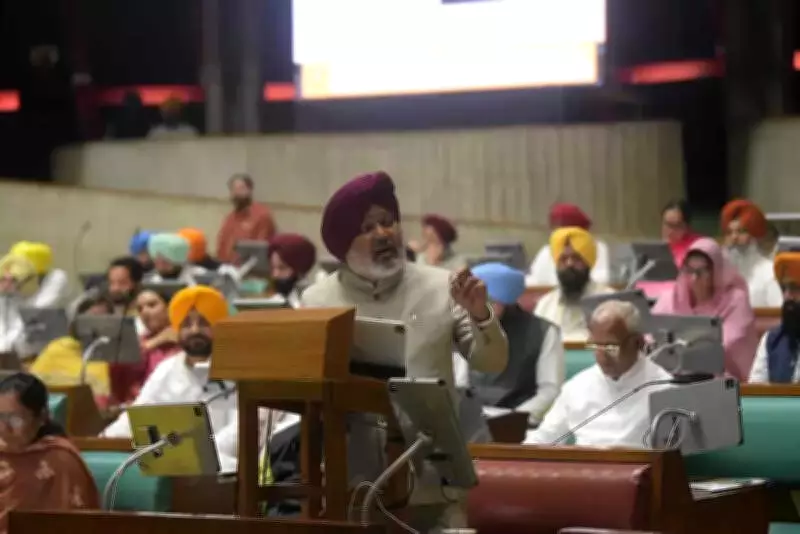
According to the Economic Survey of Punjab 2025–26, tabled in the state assembly on Sunday, Punjab's economy is expected to grow at a slower pace in the upcoming fiscal year, continuing a trend of moderate expansion observed in recent years. The state's growth rate is projected to remain below the national average, highlighting ongoing economic challenges.
Growth Projections and Historical Trends
Advance estimates indicate that Punjab's gross state domestic product (GSDP) is set to expand by 6.1% in 2025–26, a slight deceleration from the 6.3% growth recorded in 2024–25 based on quick estimates. This moderation is attributed to slower growth in key sectors such as agriculture and allied activities, as well as certain industrial segments, despite the services sector continuing to drive economic expansion.
The survey underscores that Punjab's growth rate has consistently trailed the national average since 2013–14. In 2024–25, Punjab's GSDP growth stood at 6.3%, compared to India's 6.5%. For 2025–26, India's GDP is anticipated to grow by 7.4%, significantly outpacing Punjab's projected 6.1%. A similar disparity is evident in gross state value added (GSVA) estimates, with Punjab's real GSVA growth projected at 5.6% against the national GVA growth of 7.3%.

Sectoral Contributions and Performance
Services Sector: The services sector remains the primary engine of Punjab's economy, aligning with national trends. From 2012–13 to 2022–23, services accounted for an average annual share of approximately 46% of the state's GSVA. With rising per-capita incomes and enhanced spending power, demand for services has surged. Advance estimates suggest the services sector's share in GSVA will increase to 48.5% in 2025–26, up from 47.5% in 2024–25.
Agriculture and Allied Activities: Unlike the broader national economy, agriculture continues to be a cornerstone of Punjab's economic structure. The sector is expected to contribute 22.8% to GSVA in 2025–26. Since the Green Revolution of the 1960s and 1970s, coupled with widespread mechanization, Punjab has emerged as a leading agricultural state in India. This sector plays a vital role in supporting other segments, including industry and services.
Industrial Sector: The industrial sector is projected to account for 29% of GSVA in 2025–26. Manufacturing alone contributed 17% of total GSVA and recorded an average growth rate of 5.5% between 2012–13 and 2022–23. It remains the largest contributor to GSVA growth within the industrial sector and one of the most significant subsectors overall. Punjab's agricultural focus has also fostered the development of ancillary industries such as food processing and textiles.
In 2025–26, the industry is expected to grow by 6.3%, while the services sector is forecast to expand by 8.4%. Within the industrial sector, specific growth projections include:
- Mining: 1.9%
- Manufacturing: 7.3%
- Construction: 5.9%
- Electricity, gas, and utilities: 3%
Inflation Trends and Food Prices
The survey highlights fluctuating inflation trends in Punjab during 2025–26. Inflation rose to 4.1% in April 2025 and increased further to 5.2% in May 2025, before gradually declining to 1.8% by December 2025. Throughout most of the period from April to December 2025, inflation in the state followed a declining trajectory. However, inflation at the national level remained lower than Punjab's rates during this timeframe.
Food prices exhibited mixed trends. Between 2022–23 and 2024–25, food inflation increased both in Punjab and across India. In 2025–26, food inflation peaked at 3.95% in May 2025, then dropped to 2.58% in June and 0.83% in July. After a slight rise to 1.03% in August, food inflation fell to -2.28% by December 2025. This decline was primarily driven by lower prices of vegetables, fruits, pulses, processed food, sugar, and confectionery items.
In December 2025, inflation rates for specific food categories were as follows:

- Cereals and products: 2.12%
- Oils and fats: 6.05%
- Fruits: -1.7%
- Vegetables: -24.36%
- Pulses: -7.85%
These levels were significantly lower than those recorded in December 2024, when the corresponding rates were 7.56%, 12.04%, 2.96%, 29.02%, and 7.45%. The survey also notes that rural inflation in Punjab remained higher than urban inflation during the financial years 2024–25 and 2025–26 (up to December 2025).
Disparities in Per Capita Income Across Districts
The survey reveals significant intra-state disparities in per capita income across various districts. Since 2015–16, Ropar, Mohali, and Ludhiana have consistently been the leading districts in terms of per-capita income. Ropar recorded a per-capita income of Rs 2,54,748, followed by Mohali at Rs 2,23,709 and Ludhiana at Rs 2,13,718.
While Ropar's economy is largely agrarian, with 29% of its gross district value added (GDVA) derived from agriculture and allied activities, Mohali and Ludhiana are driven by manufacturing, which contributed 30% and 31%, respectively, to their GDVA in 2022–23. Conversely, Gurdaspur and Tarn Taran recorded the lowest per-capita incomes in the state. Economic activity in these districts has been adversely affected by restrictions on economic operations and border-related tensions, as noted in the survey.
Comparative Growth Rates: Punjab vs. India
The following table illustrates the growth trends in GSDP/GDP for Punjab and India over recent years:
- 2021–22: Punjab 7.4%, India 9.7%
- 2022–23: Punjab 6.6%, India 7.6%
- 2023–24: Punjab 6.8%, India 9.2%
- 2024–25: Punjab 6.3%, India 6.5%
- 2025–26: Punjab 6.1%, India 7.4%
This data underscores the persistent gap between Punjab's economic performance and the national growth trajectory, emphasizing the need for targeted strategies to bolster the state's economic resilience and competitiveness.