Nagpur Scientists Pioneer AI Tool for Instant Pollution Detection
In a significant breakthrough for urban environmental management, researchers at the CSIR-National Environmental Engineering Research Institute (CSIR-NEERI) in Nagpur have developed an innovative artificial intelligence-based dashboard. This advanced system is designed to identify vehicular pollution hotspots across cities in real time by analyzing live feeds from traffic surveillance cameras.
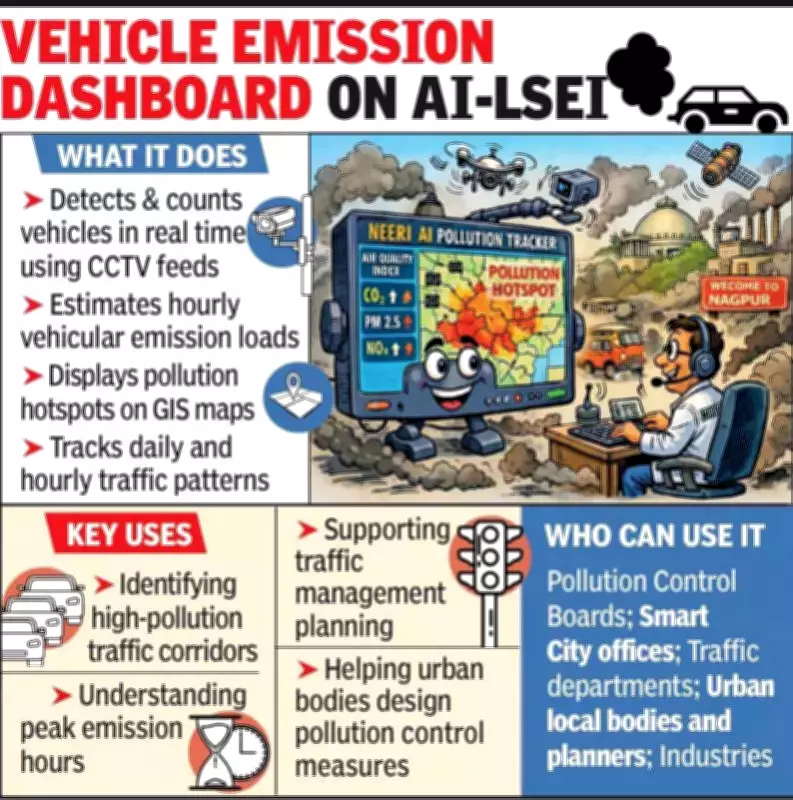
How the AI-LSEI Dashboard Works
The tool, officially named the AI-Integrated Line Source Emission Inventory (AI-LSEI) dashboard, represents a major technological leap forward. It operates by detecting and counting vehicles passing through roadways using existing CCTV infrastructure. The system then instantly calculates the pollution generated by these vehicles through sophisticated algorithms.
Key capabilities of the dashboard include:

- Classification of vehicles into six distinct categories: two-wheelers, three-wheelers, passenger cars, light commercial vehicles, buses, and heavy commercial vehicles
- Hourly calculation of emission loads for each vehicle type
- Estimation of multiple pollutants including particulate matter (PM), nitrogen oxide (NOx), carbon monoxide (CO), and hydrocarbons (HC) using scientifically established emission factors
- Display of results on a GIS-based map that visually highlights areas with high vehicular emission concentrations
Overcoming Traditional Limitations
Chief scientist KV George emphasized how this system addresses fundamental shortcomings in conventional pollution monitoring approaches. "Traditional emission inventories rely heavily on manual traffic counts and extensive surveys, which can require up to one full year to generate meaningful results," George explained. "By the time such analyses are completed, the actual number of vehicles on roads has often changed significantly. Our system provides real-time estimates based on actual, current traffic activity, making it far more responsive and accurate."
Development and Testing Process
The dashboard was developed by a dedicated team from CSIR-NEERI's air quality management division, led by senior scientist Rahul Vyawahare and chief scientist KV George. The development team included researchers Jay Singh Rajput, Atharva Malode, Raj Sonarghare, and Pranav V Nair, with support and guidance from Neeri Director S Venkata Mohan.
The system underwent rigorous testing using CCTV footage recordings obtained from multiple cities as part of earlier air pollution studies. Researchers analyzed this footage to determine traffic movement patterns and estimate corresponding emission loads across various urban locations. Following successful testing, the NEERI team deployed a pilot implementation at the institute's entrance gate on Wardha Road using their own CCTV cameras.
Practical Applications and Benefits
Vyawahare highlighted the dashboard's practical utility for urban planners and environmental authorities. "If municipal authorities need to know the emission load generated at a busy intersection like Ajni Square at any specific time, our dashboard can provide that information instantly," he stated. "The system delivers comprehensive data including hourly vehicle counts with corresponding emission loads, along with detailed gridded emissions mapping."
The dashboard tracks how traffic volume fluctuates throughout the day and correlates these patterns with pollution emissions. For instance, vehicle movement typically begins increasing sharply from early morning hours, with two-wheelers and passenger cars constituting the largest share of traffic in most urban corridors during peak periods.
The system incorporates crucial data on fuel types and engine technologies from the Parivahan portal, while utilizing emission factors derived from the Automotive Research Association of India (ARAI).

Beyond Environmental Monitoring
Scientists note that the tool offers valuable applications beyond environmental monitoring alone. The dashboard can significantly assist with urban traffic management, particularly during major events. For example, when large gatherings occur at city stadiums for sports matches or concerts, authorities can use the dashboard to visualize vehicle counts and corresponding emissions in real time, enabling more informed traffic control decisions.
This innovative development represents a powerful convergence of artificial intelligence, environmental science, and urban planning, offering cities a practical tool to combat air pollution with unprecedented speed and precision.