A powerful winter storm swept across the United States in late January, blanketing numerous states with heavy snow and ice. However, the most remarkable aspect wasn't the storm itself, but what followed. Instead of dissipating, the frigid air lingered for days, creating a prolonged deep freeze that affected a vast region, particularly areas east of the Rocky Mountains.
NASA's Animated Map Reveals the Cold's Persistence
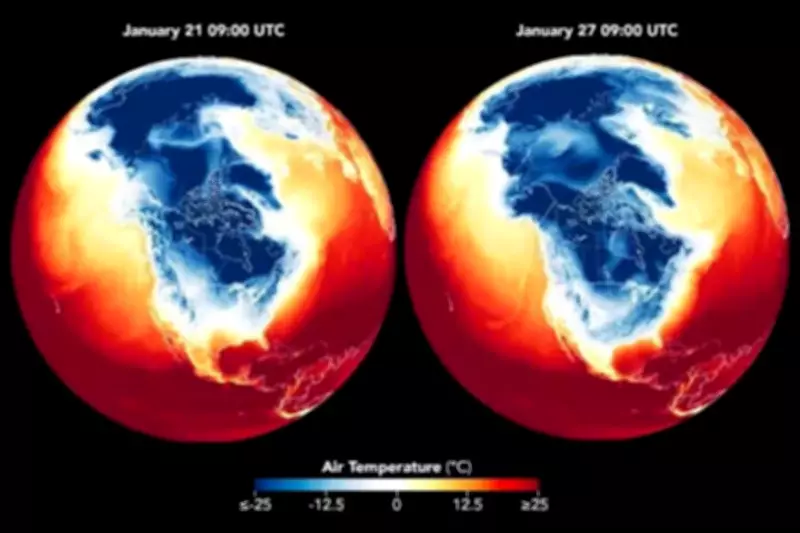
NASA has released a compelling animation that functions as a dynamic map, illustrating daily temperature patterns across the affected regions. The visualization uses dark blue to indicate areas experiencing extreme cold. While the map shows the natural daily fluctuations with temperatures rising slightly during daylight hours and dropping at night, the overall pattern is unmistakable. The cold air mass didn't simply pass through; it spread southward and settled, creating a stubborn, stationary zone of freezing conditions.
Origins of the Arctic Invasion
NASA's observations confirm that this extreme cold originated from arctic regions in northern Canada and even Siberia. The movement was driven by high-pressure systems that pushed the jet stream southward. This atmospheric shift acted like a guide rail, channeling the freezing air deep into the United States. When this frigid air collided with moist air systems, it triggered the significant snowfall and ice accumulation that stretched from the Southwest all the way to New England.

Record-Breaking Cold Grips the Nation
The intensity of this cold wave was extraordinary. Nebraska experienced temperatures plunging to a bone-chilling −26°F (−32°C). Even typically warmer regions like Texas weren't spared, with temperatures falling into the single digits, creating conditions unfamiliar to many residents. The situation was exacerbated by wind, which made temperatures feel even colder. Wind chills dropped as low as −20°F (−29°C) in the Midwest and Northeast, creating dangerously cold conditions for extended periods.
NASA's Comprehensive Temperature Tracking
NASA meticulously monitored this event using a sophisticated approach that blended satellite data with its GEOS global model. The resulting maps clearly show dark blue zones—representing the coldest surface air—expanding southward and eastward between January 21 and 29. While daily variations created some flickering in the visualization, the underlying trend remained consistent and alarming. The cold air expanded its reach, paused, and only gradually began to retreat, demonstrating its persistent nature.
What made this event particularly notable was its scale. Unlike isolated cold pockets that sometimes affect specific regions, this deep freeze covered enormous portions of North America, creating a widespread weather phenomenon of significant magnitude.
NASA's Role in Disaster Response and Recovery
During this severe weather event, NASA activated its Disasters Response Coordination System. The agency provided crucial maps and data through its open-access portal, offering valuable resources to emergency managers and response teams. These tools proved instrumental in tracking evolving conditions and planning effective response strategies.
As weather forecasts indicated the possibility of continued cold conditions into early February, the focus shifted from expecting quick recovery to preparing for endurance. The eventual easing of conditions occurred in stages and unevenly across different regions, leaving some areas waiting longer than others for relief from the persistent freeze.