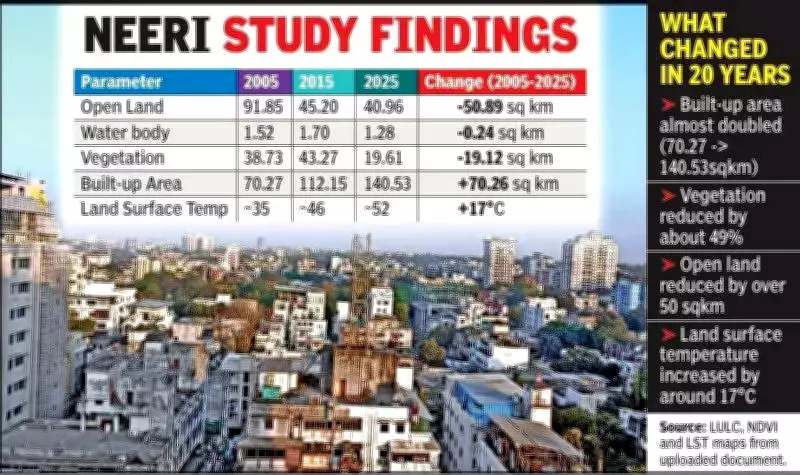
Nagpur's land surface temperature (LST) has increased dramatically over the past 21 years, climbing from approximately 35°C in 2005 to nearly 52°C in 2025. This significant rise highlights the growing impact of rapid urbanisation and shrinking green spaces on the city's microclimate, according to a recent study by CSIR-NEERI scientist Shalini Dhyani.
Study Reveals Alarming Temperature Trends
A comparative analysis of land use, vegetation, and temperature patterns between 2005 and 2025 was conducted by Shalini Dhyani, head of the centre of ecological systems and resilience design at CSIR-NEERI. Released on the eve of World Environment Day, the study reveals a strong link between expanding built-up areas, declining vegetation, and rising surface temperatures. The findings raise fresh concerns over increasing heat stress, energy demand, and the long-term sustainability of urban growth in Nagpur.
Built-Up Area Nearly Doubles
The study shows that Nagpur's built-up area nearly doubled during the period, increasing from 70.27 square kilometres (34.72% of the city's area) in 2005 to 140.53 square kilometres (69.43%) in 2025. Large tracts of open land and vegetated areas were gradually converted into residential, commercial, and infrastructure projects, making built-up land the dominant land-use category across the city.

Vegetation Cover Declines Sharply
The loss of greenery has been particularly significant. Vegetation cover, which accounted for nearly one-fifth of the city's area in 2005, witnessed a steady decline over the years. While green cover stood at 43.27 square kilometres (21.39%) in 2015, it dropped sharply to 19.61 square kilometres (9.69%) by 2025. This indicates the erosion of natural cooling zones that help regulate urban temperatures.
NDVI Maps Show Fragmented Green Spaces
The assessment's normalised difference vegetation index (NDVI) maps further reinforce this trend. In 2005, Nagpur had extensive patches of moderate-to-high vegetation cover. By 2015, these green areas had become fragmented due to rapid development. By 2025, most parts of the city exhibited low-to-moderate vegetation values, reflecting a continuous decline in ecological resources and urban green spaces.
Temperature Maps Reflect Transformation
The temperature maps reveal a parallel transformation. Areas with vegetation and water bodies recorded relatively lower surface temperatures in 2005. However, warmer zones expanded significantly by 2015, particularly in rapidly urbanising pockets. By 2025, high-temperature zones had spread across much of the city, exacerbating the urban heat island effect.
Factors Driving the Warming Trend
Dhyani attributed such warming trends to multiple factors, including the urban heat island effect, loss of tree cover, increasing vehicular movement, higher energy consumption, reduction in permeable open spaces, and broader climatic changes. Although water bodies remained relatively stable, their share declined marginally from 0.75% in 2005 to 0.63% in 2025. While regulatory protections have prevented major losses, concerns remain over encroachments and the shrinking cooling influence of aquatic ecosystems.
Urgent Need for Sustainable Planning
Dhyani stated, "LULC, NDVI, and LST analyses present a clear picture. Nagpur's rapid urban expansion has come at the cost of vegetation and open spaces, intensifying the urban heat island effect and pushing surface temperatures to alarming levels. The findings underline the urgent need for sustainable urban planning, protection of green spaces, and large-scale afforestation measures to mitigate future heat risks."